
Amazon Best Seller Rank, commonly known as BSR, is one of the most visible yet misunderstood metrics on Amazon. Sellers often rely on it to judge product performance, but without proper understanding, BSR can lead to incorrect assumptions. BSR is not a direct measure of revenue or profit; instead, it ranks products based on how well they are selling compared to other items within the same category. A lower BSR indicates stronger relative sales performance, while a higher BSR suggests weaker sales activity.
How Amazon Calculates BSR
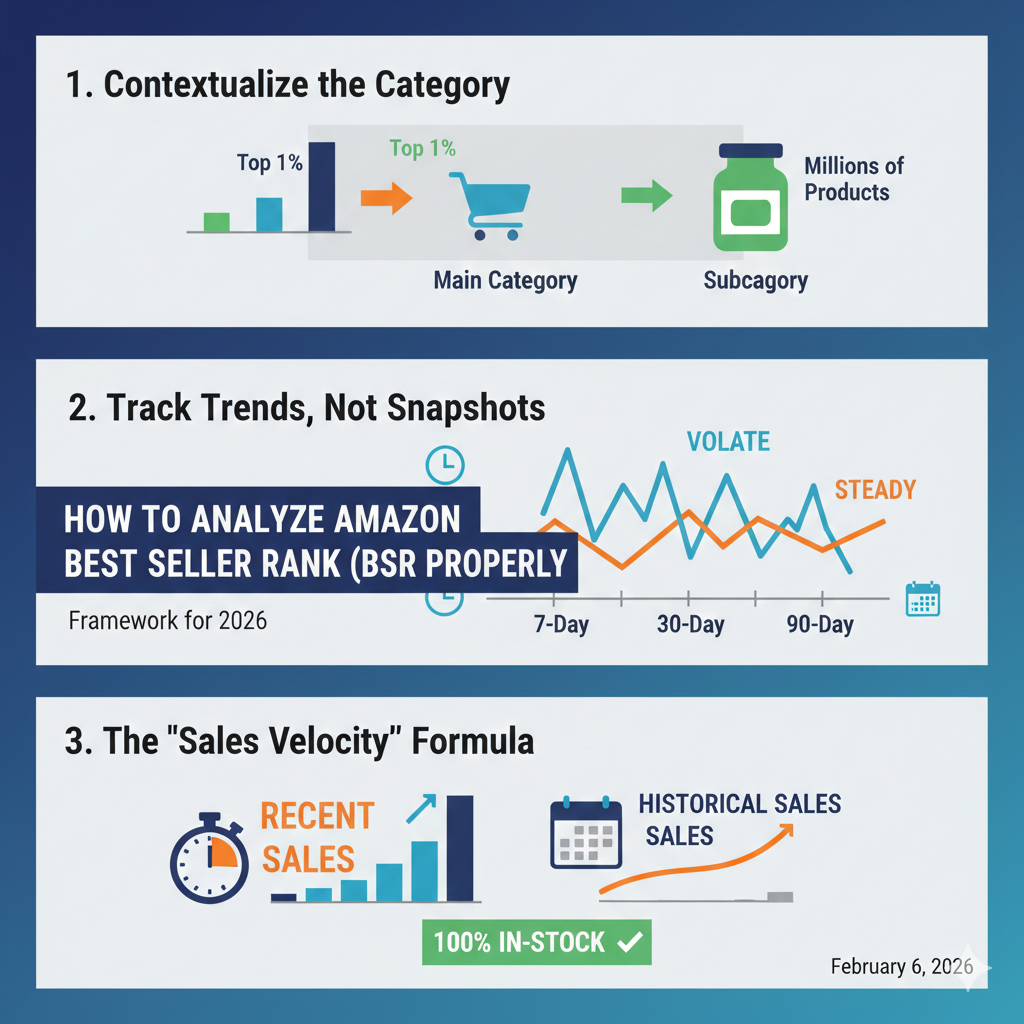
Amazon does not disclose the exact formula used to calculate BSR, but it is widely understood that recent sales velocity is the most influential factor. Products that generate frequent and consistent sales tend to improve their BSR quickly, while even short periods of low sales can cause rankings to rise. Historical sales data also plays a role, meaning older listings with steady demand often experience less volatility than newer products. Because of this dynamic calculation, BSR can change multiple times throughout the day.
Why BSR Should Not Be Analyzed in Isolation
One of the most common mistakes sellers make is evaluating BSR without context. Looking at a single BSR snapshot does not provide an accurate picture of product performance. Temporary factors such as discounts, giveaways, or advertising campaigns can significantly improve BSR for a short period. Without analyzing trends over time, sellers may incorrectly assume a product has strong long-term demand when it is only benefiting from a short-term boost.
The Importance of Category Context
BSR is category-specific, which means it only reflects performance relative to other products in the same category. Different categories have vastly different sales volumes and competition levels. A product ranked 15,000 in a large category like Home & Kitchen may still generate consistent daily sales, while the same rank in a small niche category may indicate very limited demand. For accurate analysis, sellers should always evaluate BSR within the product’s primary category rather than relying on subcategory rankings that may appear misleadingly strong.
Analyzing BSR Trends Over Time
Proper BSR analysis requires observing how the rank changes over time rather than focusing on a single moment. A product that maintains a stable or gradually improving BSR over several weeks typically reflects consistent demand. In contrast, sudden drops followed by sharp increases often indicate temporary promotions or irregular sales patterns. Trend analysis helps sellers distinguish between sustainable products and those experiencing short-lived success.
Combining BSR With Reviews for Better Insights
BSR becomes far more meaningful when combined with review data. Reviews provide insight into a product’s maturity, customer trust, and competitive strength. A product with a low BSR and a small number of reviews may represent a newer listing gaining traction, which could signal an opportunity. Conversely, a low BSR combined with a high review count often indicates a well-established competitor that may be difficult to outrank. Products with many reviews but declining BSR may suggest fading demand or increased competition.
Understanding Category Benchmarks and Sales Potential
Each Amazon category behaves differently, making it essential to understand typical BSR benchmarks within your niche. High-traffic categories generally allow products with higher BSRs to still achieve meaningful sales, while low-traffic categories require much lower BSRs to indicate similar demand. Comparing BSRs only among similar products within the same category provides a more realistic understanding of sales potential.
Evaluating BSR Alongside Price and Profitability
While BSR reflects sales velocity, it does not indicate how much revenue or profit a product generates. Two products with similar BSRs can produce very different results depending on price, fulfillment costs, and advertising expenses. A higher-priced product with slightly weaker BSR may still generate significantly more revenue than a low-priced item ranking higher. For this reason, BSR should always be evaluated alongside pricing and cost structure to assess true business potential.
Using BSR as a Strategic Performance Indicator
BSR is most effective when used as a directional performance indicator rather than a fixed success metric. Sellers can track BSR changes to evaluate the impact of listing optimizations, pricing adjustments, or advertising campaigns. Consistent improvement in BSR often signals increased sales momentum, while declining trends can act as early warnings of reduced demand or growing competition.
Final Thoughts on Analyzing BSR Properly
Amazon Best Seller Rank is a powerful tool when used correctly, but it should never be treated as the sole indicator of product success. By understanding how BSR is calculated, analyzing trends over time, considering category context, and combining it with reviews, pricing, and profitability data, sellers can make smarter and more informed decisions. When approached strategically, BSR becomes a valuable insight into market demand and competitive positioning on Amazon.